

Argo CD と Helm で構築する Grafana/Prometheus 環境 #Zaim

Zaim インフラチームの尾形です。この記事は くふうカンパニー Advent Calendar 2019 11 日目の記事です。
Zaim が、くふうグループにジョインしてから初めてのアドベントカレンダーになります。みなさんとても良い記事を書いていますね。
本記事では、Argo CD と Helm を使って Grafana/Prometheus の環境を構築・管理するためのノウハウを共有します。
なお、前提とする Argo CD のインストール方法や、Argo CD・Grafana・Prometheus の使い方などは説明しません。
k8s 環境の監視に Grafana/Prometheus を採用
Zaim ではインフラを全面的に k8s(Kubernetes)へと絶賛刷新中です。監視はもともと Zabbix を使っていましたが、これを機に Grafana/Prometheus へ移管しました。
Grafana は Zabbix でも使えますが、わざわざ Prometheus にしたのは以下の理由になります。
CNCF(Cloud Native Computing Foundation)の Graduated(卒業)である
必ずしもデータベースを用意しなくて良いのでコストが良い
コストかけなくても軽量で早い
Go 言語で作られているので今後の Zaim と合っている
Go 言語で作られた Plugin が多く、必要であれば参考にしながら作成できる
Zabbix が悪いといっているわけではありませんが、Zaim の現状を考えると今回は Prometheus を採用しました。
以下、今回、出てくるツールを簡単に紹介します。ご存知のかたは、すっ飛ばしてください。
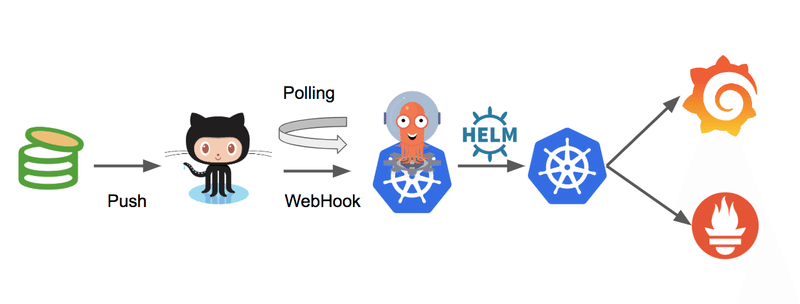
(1)Argo CD
Argo CD is a declarative, GitOps continuous delivery tool for Kubernetes.
k8s の CD(Continuous Delivery)を GitOps で実現するツールです。似たようなことができるツールに Spinnaker がありますが、Spinnaker よりシンプルで扱いやすいと個人的には感じています。
Sync の設定をしておくと、Sync 対象の Git リポジトリにあるマニフェストの状態を維持してくれます。誤って k8s Deployment や Service を削除しても、Sync の設定次第では数分で復元してくれます。もちろん誤って削除しないことがベストですが……。
誤って Git リポジトリのマニフェストファイルを削除すると、同期してリソースが消えてしまうので、Pull Request 以外では Sync 対象のブランチに Push できない設定にしておくと安心です。
Argo CD では自前でピュアなマニフェストファイルを管理することは勿論、Kustomize や Helm も使えます。
ちなみに 2019 年 11 月 14 日に、Flux CD との統合プロジェクト Argo Flux が発表されました。今後はそちらが主流になっていきそうなので、期待大です。
(2)Helm
The package manager for Kubernetes
k8s のパッケージを管理してくれる人です。
helm install stable/prometheusといったコマンドで、サクッと Prometheus などをインストールできます。
(3)Prometheus
Power your metrics and alerting with a leading open-source monitoring solution.
メトリクスの収集やアラートを投げることが可能です。k8s でメトリクスを収集するのに、よく使われますね。CNCFの Trail Map の Observability & Analysis に載っているのも Prometheus です。
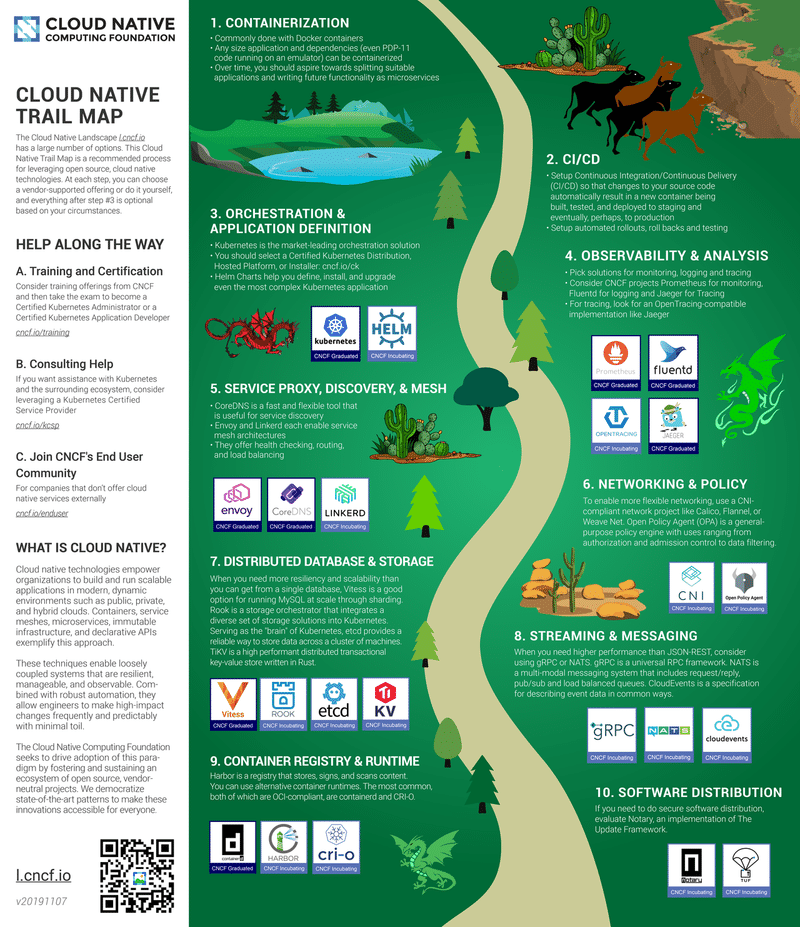
Helm と Prometheus はありますが、Argo CD と Grafana は載っていませんでした……。残念(何が
(4)Grafana
Grafana is the open source analytics & monitoring solution for every database
さまざまなデータソースをいい感じのグラフ・ダッシュボードで表示できるツールです。Prometheus を使う場合はセットで利用することが多いかと思います。
公式ではサポートしていないものの、プラグインで Zabbix をデータソースにすることも可能です。
Prometheus だけでもアラートを投げられますが、Grafanaに比べると認証機構が弱いため、Prometheus を VPC 内に閉じ込めて、Grafana にアラートを設定する構成が最も一般的ではないでしょうか。
Argo CD+Helm で Prometheus・Grafana を構築
Argo CD のインストール方法は割愛します。まずは Grafana の Argo CD のマニフェストを見ていきます。
(1)Argo CD Helm Grafana Manifest File
apiVersion: argoproj.io/v1alpha1
kind: Application
metadata:
 name: grafana-staging
 namespace: argocd
spec:
 destination:
   namespace: grafana
   server: https://kubernetes.default.svc
 project: monitoring
 source:
   path: kubernetes/grafana/staging
   repoURL: https://github.com/xxx/xxx.git
   targetRevision: HEAD
 syncPolicy:
   automated:
     prune: true
---
apiVersion: argoproj.io/v1alpha1
kind: Application
metadata:
 name: grafana-helm-staging
 namespace: argocd
spec:
 destination:
   namespace: grafana
   server: https://kubernetes.default.svc
 project: monitoring
 source:
   repoURL: https://github.com/helm/charts.git
   targetRevision: 39723f2574290702c0fae03f4573ce31d3707e6c
   path: stable/grafana
   helm:
     parametrs:
     - name: persistence.storageClassName
       value: gp2
     - name: adminPassword
       value: Password
     releaseName: grafana
     valueFiles:
     - https://raw.githubusercontent.com/helm/charts/ce946802c980eac7e741931c92e0305df65b10ec/stable/grafana/values.yaml
     - https://xxx.s3-ap-northeast-1.amazonaws.com/helm/grafana/staging/values.yaml?apply=1
 syncPolicy:
   automated:
     prune: true
Helm では Namespace まで作ってくれないので、Namespace は自前で管理します。以下のように Kustomize で管理しています。
kubernetes/grafana/base/kustomize.yaml
apiVersion: kustomize.config.k8s.io/v1beta1
kind: Kustomization
resources:
- namespace.yaml
kubernetes/grafana/base/namespace.yaml
apiVersion: v1
kind: Namespace
metadata:
 name: grafana
kubernetes/grafana/staging/kustomize.yaml
kind: Kustomization
apiVersion: kustomize.config.k8s.io/v1beta1
resources:
- ../base
Argo CD の設定を見ると、Helm の Values Files をパスで指定していることが分かります。
   helm:
     parametrs:
     - name: persistence.storageClassName
       value: gp2
     - name: adminPassword
       value: Password
     releaseName: grafana
     valueFiles:
     - https://raw.githubusercontent.com/helm/charts/ce946802c980eac7e741931c92e0305df65b10ec/stable/grafana/values.yaml
     - https://xxx.s3-ap-northeast-1.amazonaws.com/helm/grafana/staging/values.yaml?apply=1
valueFiles の一つ目の URL は、Chart に公開されているデフォルト Values を指定しています。その次の URL は何かというと、自前で設定したい Values Files を指定しています。
Cannot apply local values.yaml to deployed Helm chart の Issue にあるように、2019 年 12 月 11 日現在、Argo CD では Private Repository に配置したファイルを読めないため、Public な空間にファイルを配置する必要があります。
Issue 内のコメントで提示されている通り、Parameters で一つずつ設定することも可能ですが、Values に設定する値が増えるほど可読性が下がってしまいます。
また、謎のクエリパラメータ ?apply=1 が付与されているのは、ファイルを更新しても Argo CD がファイルの中の更新を検知してくれないためです。values.yaml を更新するたびに ?apply=2 とインクリメントするので「ファイルが更新された」ということを教えてあげています。
ここを「もっとクールに解決しているよ!」という方がいましたら、ぜひご教示ください……!
なお今回は AWS S3 を利用していますが、Public なファイルストレージであればどこでも良さそうです。
ちなみに AWS S3 には IP を制限する機能があるので、Argo CD の IP だけ許可してみました。しかし Helm の Chart が GitHub にあるからか、GitHub からアクセスするような挙動を見せたため、上手くいきませんでした...涙
(2)Helm Grafana Values Files
Helm Chats のデフォルト値で運用するならここまでで問題ないのですが、実際はグラフやダッシュボード、アラートをコード管理したり、ディスク容量や Ingress の設定もしたくなると思います。そうした場合の設定は、以下のようになります。
Sample
ingress:
 enabled: true
 path: /*
 servicePort: 3000
 hosts:
 - grafana.example.com
 annotations:
   kubernetes.io/ingress.class: alb
   alb.ingress.kubernetes.io/actions.ssl-redirect: '{"Type": "redirect", "RedirectConfig": { "Protocol": "HTTPS", "Port": "443", "StatusCode": "HTTP_301"}}'
   alb.ingress.kubernetes.io/listen-ports: '[{"HTTP": 80}, {"HTTPS":443}]'
   alb.ingress.kubernetes.io/success-codes: 200,201,204,302
   alb.ingress.kubernetes.io/scheme: internet-facing
   alb.ingress.kubernetes.io/security-groups: sg-xxx
   alb.ingress.kubernetes.io/certificate-arn: arn:aws:acm:ap-northeast-1:0123456789:certificate/xxx
   alb.ingress.kubernetes.io/backend-protocol: HTTP
   alb.ingress.kubernetes.io/healthcheck-path: /login
   alb.ingress.kubernetes.io/ssl-policy: ELBSecurityPolicy-TLS-1-2-Ext-2018-06
datasources:
datasources.yaml:
  apiVersion: 1
  datasources:
  - name: Prometheus
    type: prometheus
    url: http://prometheus-server.prometheus.svc.cluster.local
    access: proxy
    isDefault: true
env:
 GF_SERVER_ROOT_URL: https://grafana.example.com
 GF_EXTERNAL_IMAGE_STORAGE_PROVIDER: s3
 GF_EXTERNAL_IMAGE_STORAGE_S3_BUCKET_URL: https://xxx-grafana.s3-ap-northeast-1.amazonaws.com/
service:
 type: NodePort
 port: 80
 targetPort: 3000
 protocol: TCP
persistence:
 type: pvc
 enabled: true
 storageClassName: gp2
 accessModes:
   - ReadWriteOnce
 size: 10Gi
 finalizers:
   - kubernetes.io/pvc-protection
notifiers:
notifiers.yaml:
  notifiers:
  - name: PagerDutyOnCall
    type: pagerduty
    uid: PagerDutyOnCall
    org_id: 1
    is_default: false
    settings:
      integrationKey: KEY
      autoResolve: true
  - name: SlackAlertProduction
    type: slack
    uid: SlackAlertProduction
    org_id: 1
    is_default: false
    settings:
      url: https://hooks.slack.com/services/TOKEN
      mention: "@channel"
      userName: grafana
  - name: SlackNoMentionAlertProduction
    type: slack
    uid: SlackNoMentionAlertProduction
    org_id: 1
    is_default: false
    settings:
      url: https://hooks.slack.com/services/TOKEN
dashboardProviders:
dashboardproviders.yaml:
  apiVersion: 1
  providers:
  - name: sample
    orgId: 1
    folder: 'sample'
    type: file
    disableDeletion: false
    editable: false
    options:
      path: /var/lib/grafana/dashboards/sample
dashboards:
 sample:
   health-check-dashboard:
     json: |
       {
         "annotations": {
           "list": [
             {
               "builtIn": 1,
               "datasource": "-- Grafana --",
               "enable": true,
               "hide": true,
               "iconColor": "rgba(0, 211, 255, 1)",
               "name": "Annotations & Alerts",
               "type": "dashboard"
             }
           ]
         },
         "editable": true,
         "gnetId": null,
         "graphTooltip": 0,
         "links": [],
         "panels": [
           {
             "alert": {
               "alertRuleTags": {},
               "conditions": [
                 {
                   "evaluator": {
                     "params": [
                       1
                     ],
                     "type": "lt"
                   },
                   "operator": {
                     "type": "and"
                   },
                   "query": {
                     "params": [
                       "A",
                       "1m",
                       "now"
                     ]
                   },
                   "reducer": {
                     "params": [],
                     "type": "avg"
                   },
                   "type": "query"
                 }
               ],
               "executionErrorState": "alerting",
               "for": "3m",
               "frequency": "1m",
               "handler": 1,
               "name": "HTTP HealthCheck alert",
               "noDataState": "keep_state",
               "notifications": [
                 {
                   "uid": "PagerDutyOnCall"
                 },
                 {
                   "uid": "SlackAlertProduction"
                 }
               ]
             },
             "aliasColors": {},
             "bars": false,
             "dashLength": 10,
             "dashes": false,
             "datasource": null,
             "fill": 1,
             "fillGradient": 0,
             "gridPos": {
               "h": 9,
               "w": 12,
               "x": 0,
               "y": 0
             },
             "id": 2,
             "legend": {
               "avg": false,
               "current": false,
               "max": false,
               "min": false,
               "show": true,
               "total": false,
               "values": false
             },
             "lines": true,
             "linewidth": 1,
             "nullPointMode": "null",
             "options": {
               "dataLinks": []
             },
             "percentage": false,
             "pointradius": 2,
             "points": false,
             "renderer": "flot",
             "seriesOverrides": [],
             "spaceLength": 10,
             "stack": false,
             "steppedLine": false,
             "targets": [
               {
                 "expr": "probe_success{instance!=\"https://api.example.com/versions\"}",
                 "legendFormat": "{{instance}}",
                 "refId": "A"
               }
             ],
             "thresholds": [
               {
                 "colorMode": "critical",
                 "fill": true,
                 "line": true,
                 "op": "lt",
                 "value": 1
               }
             ],
             "timeFrom": null,
             "timeRegions": [],
             "timeShift": null,
             "title": "HTTP HealthCheck",
             "tooltip": {
               "shared": true,
               "sort": 0,
               "value_type": "individual"
             },
             "type": "graph",
             "xaxis": {
               "buckets": null,
               "mode": "time",
               "name": null,
               "show": true,
               "values": []
             },
             "yaxes": [
               {
                 "format": "short",
                 "label": null,
                 "logBase": 1,
                 "max": null,
                 "min": null,
                 "show": true
               },
               {
                 "format": "short",
                 "label": null,
                 "logBase": 1,
                 "max": null,
                 "min": null,
                 "show": true
               }
             ],
             "yaxis": {
               "align": false,
               "alignLevel": null
             }
           },
           {
             "cacheTimeout": null,
             "datasource": null,
             "gridPos": {
               "h": 9,
               "w": 12,
               "x": 12,
               "y": 0
             },
             "id": 4,
             "interval": "",
             "links": [],
             "options": {
               "fieldOptions": {
                 "calcs": [
                   "mean"
                 ],
                 "defaults": {
                   "mappings": [],
                   "max": 100,
                   "min": 95,
                   "thresholds": [
                     {
                       "color": "red",
                       "value": null
                     },
                     {
                       "color": "green",
                       "value": 99.5
                     }
                   ]
                 },
                 "override": {},
                 "values": false
               },
               "orientation": "horizontal",
               "showThresholdLabels": false,
               "showThresholdMarkers": true
             },
             "pluginVersion": "6.4.2",
             "targets": [
               {
                 "expr": "avg_over_time(probe_success{instance!=\"https://api.example.com/versions\"}[7d]) * 100",
                 "format": "time_series",
                 "intervalFactor": 1,
                 "legendFormat": "{{instance}}",
                 "refId": "A"
               }
             ],
             "timeFrom": null,
             "timeShift": null,
             "title": "Uptime for 7 day",
             "type": "gauge"
           },
           {
             "aliasColors": {},
             "bars": false,
             "dashLength": 10,
             "dashes": false,
             "datasource": "Prometheus",
             "fill": 1,
             "fillGradient": 0,
             "gridPos": {
               "h": 9,
               "w": 12,
               "x": 12,
               "y": 9
             },
             "id": 7,
             "legend": {
               "avg": false,
               "current": false,
               "max": false,
               "min": false,
               "show": true,
               "total": false,
               "values": false
             },
             "lines": true,
             "linewidth": 1,
             "nullPointMode": "null",
             "options": {
               "dataLinks": []
             },
             "percentage": false,
             "pointradius": 2,
             "points": false,
             "renderer": "flot",
             "seriesOverrides": [],
             "spaceLength": 10,
             "stack": false,
             "steppedLine": false,
             "targets": [
               {
                 "expr": "probe_dns_lookup_time_seconds + probe_duration_seconds",
                 "legendFormat": "{{instance}}",
                 "refId": "A"
               }
             ],
             "thresholds": [],
             "timeFrom": null,
             "timeRegions": [],
             "timeShift": null,
             "title": "Response Time (sec)",
             "tooltip": {
               "shared": true,
               "sort": 0,
               "value_type": "individual"
             },
             "type": "graph",
             "xaxis": {
               "buckets": null,
               "mode": "time",
               "name": null,
               "show": true,
               "values": []
             },
             "yaxes": [
               {
                 "format": "short",
                 "label": null,
                 "logBase": 1,
                 "max": null,
                 "min": null,
                 "show": true
               },
               {
                 "format": "short",
                 "label": null,
                 "logBase": 1,
                 "max": null,
                 "min": null,
                 "show": true
               }
             ],
             "yaxis": {
               "align": false,
               "alignLevel": null
             }
           }
         ],
         "refresh": false,
         "schemaVersion": 20,
         "style": "dark",
         "tags": [],
         "templating": {
           "list": []
         },
         "time": {
           "from": "now-24h",
           "to": "now"
         },
         "timepicker": {
           "refresh_intervals": [
             "5s",
             "10s",
             "30s",
             "1m",
             "5m",
             "15m",
             "30m",
             "1h",
             "2h",
             "1d"
           ]
         },
         "timezone": "",
         "title": "HealthCheck Dashboard",
         "uid": "5Rj2HSAF4",
         "version": 6
       }
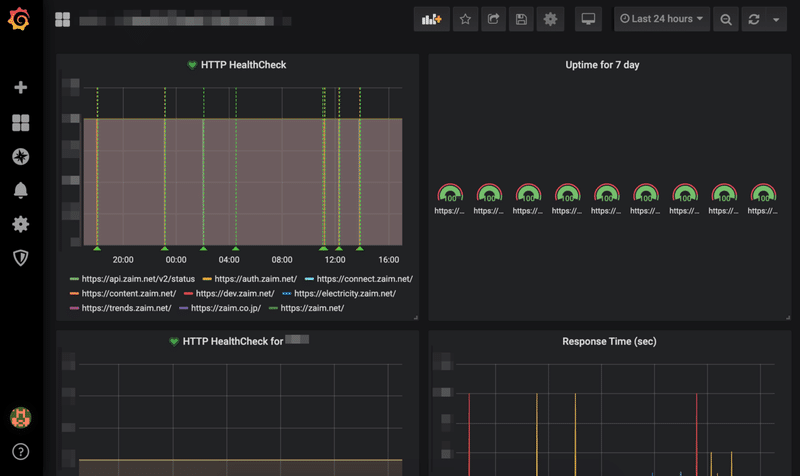
はい、ファイルめっちゃ大きいですね。ちなみに今回のサンプルは Dashboard を一つ、Panel が三つだけです。本格的に運用するとなるともっと増えるかと思います。その時は、いい感じに Values Files を分割してあげてください。
設定できる値は
に記載されていて、シンプルな公式サンプルは
にあります。
ざっくり一つずつ見ていきます。
Ingress
ingress:
 enabled: true
 path: /*
 servicePort: 3000
 hosts:
 - grafana.example.com
 annotations:
   kubernetes.io/ingress.class: alb
   alb.ingress.kubernetes.io/actions.ssl-redirect: '{"Type": "redirect", "RedirectConfig": { "Protocol": "HTTPS", "Port": "443", "StatusCode": "HTTP_301"}}'
   alb.ingress.kubernetes.io/listen-ports: '[{"HTTP": 80}, {"HTTPS":443}]'
   alb.ingress.kubernetes.io/success-codes: 200,201,204,302
   alb.ingress.kubernetes.io/scheme: internet-facing
   alb.ingress.kubernetes.io/security-groups: sg-xxx
   alb.ingress.kubernetes.io/certificate-arn: arn:aws:acm:ap-northeast-1:0123456789:certificate/xxx
   alb.ingress.kubernetes.io/backend-protocol: HTTP
   alb.ingress.kubernetes.io/healthcheck-path: /login
   alb.ingress.kubernetes.io/ssl-policy: ELBSecurityPolicy-TLS-1-2-Ext-2018-06
今回は ALB Ingress Controller のサンプルになります。その他の Ingress を利用している方は、適宜アノテーションを読み換えていただければと思います。
Datasouces
datasources:
  datasources.yaml:
    apiVersion: 1
    datasources:
    - name: Prometheus
      type: prometheus
      url: http://prometheus-server.prometheus.svc.cluster.local
      access: proxy
      isDefault: true
Grafana のデータソースを指定する所になります。今回は Prometheus を利用するため、Prometheus の設定を記載しています。その他のデータソースを設定したい場合は、ここに随時追加すると反映されます。
url: は Prometheus を Helm のデフォルト設定で作成した値になります。
Env
env:
 GF_SERVER_ROOT_URL: https://grafana.example.com
 GF_EXTERNAL_IMAGE_STORAGE_PROVIDER: s3
 GF_EXTERNAL_IMAGE_STORAGE_S3_BUCKET_URL: https://xxx-grafana.s3-ap-northeast-1.amazonaws.com/
GF_SERVER_ROOT_URL は、Grafana が Slack に通知した時のリンクなどに使います。適宜、変更してください。
Slack に通知する際に Grafana がグラフの画像を添付できるようにするために、GF_EXTERNAL_IMAGE_STORAGE_PROVIDER やGF_EXTERNAL_IMAGE_STORAGE_S3_BUCKET_URL を設定します。この辺も、ご利用のストレージプロバイダーに読み換えて設定してください。
これらの値は Grafana Docker で設定できる値です。k8s で動かすので当たり前といえば当たり前ですが。最初、Helm Charts の README に記載されている説明を見て
Extra environment variables passed to pods
しか書いてなかったので少し迷子になりました……。
その他の値は、Grafana Docker 公式の設定方法を参照してください。
Service
service:
 type: NodePort
 port: 80
 targetPort: 3000
 protocol: TCP
ただの k8s Service の設定です。適宜、必要な値に書き換えてください。ALB Ingress Controller を利用しない場合は NodePort ではなく LoadBalancer などになるかと思います。
Persistence
persistence:
 type: pvc
 enabled: true
 storageClassName: gp2
 accessModes:
   - ReadWriteOnce
 size: 10Gi
 finalizers:
   - kubernetes.io/pvc-protection
k8s Persistent Volume Claims の設定です。Grafana のデータを保存する場所になります。今回も AWS の設定になっているため、 必要であれば storageClassName は置き換えてください。
Notifiers
notifiers:
  notifiers.yaml:
    notifiers:
    - name: PagerDutyOnCall
      type: pagerduty
      uid: PagerDutyOnCall
      org_id: 1
      is_default: false
      settings:
        integrationKey: KEY
        autoResolve: true
    - name: SlackAlertProduction
      type: slack
      uid: SlackAlertProduction
      org_id: 1
      is_default: false
      settings:
        url: https://hooks.slack.com/services/TOKEN
        mention: "@channel"
        userName: grafana
    - name: SlackNoMentionAlertProduction
      type: slack
      uid: SlackNoMentionAlertProduction
      org_id: 1
      is_default: false
      settings:
        url: https://hooks.slack.com/services/TOKEN
Grafana のアラート通知設定をします。アラート発生時にどの通知方法で通知するかを選ぶ際に利用します。今回のサンプルでは PagerDuty, Slack の設定を記載してあります。Email や OpsGenie など、ほかにもさまざまな通知方法を設定できます。
各種設定を YAML で設定する方法を見つけられなかったので、Grafana GUI にあるアラート通知の設定画面の値から、キーを予想しながら泥臭く設定しました。良いドキュメントあったら知りたい……。
ここで設定した uid を後のグラフで利用します。
DashboardProviders
dashboardProviders:
  dashboardproviders.yaml:
    apiVersion: 1
    providers:
    - name: sample
      orgId: 1
      folder: 'sample'
      type: file
      disableDeletion: false
      editable: false
      options:
        path: /var/lib/grafana/dashboards/sample
Dashboard を束ねる設定を記載する所になります。path の配下に、この後、記載するグラフの JSON が配置されます。用途によって分けると良いかと思います。
ここの editable を false にすると、定義したダッシュボードを GUI で変更できなくなります。コードで管理されたところ以外は、絶対に変更してほしくない!という強いお気持ちを表明できます。
これで Immutable Dashboards & Alert が実現できました!!
Grafana を何回ぶっ壊しても大丈夫!!
Dashboards
dashboards:
 sample:
   health-check-dashboard:
     json: |
       {
         "annotations": {
           "list": [
             {
               "builtIn": 1,
               "datasource": "-- Grafana --",
               "enable": true,
               "hide": true,
               "iconColor": "rgba(0, 211, 255, 1)",
               "name": "Annotations & Alerts",
               "type": "dashboard"
             }
           ]
         },
         "editable": true,
         "gnetId": null,
         "graphTooltip": 0,
         "links": [],
~~
dashboardProviders で定義した sample フォルダに、ダッシュボードを作成しています。
~~
         "panels": [
           {
             "alert": {
               "alertRuleTags": {},
               "conditions": [
                 {
                   "evaluator": {
                     "params": [
                       1
                     ],
                     "type": "lt"
                   },
                   "operator": {
                     "type": "and"
                   },
                   "query": {
                     "params": [
                       "A",
                       "1m",
                       "now"
                     ]
                   },
                   "reducer": {
                     "params": [],
                     "type": "avg"
                   },
                   "type": "query"
                 }
               ],
               "executionErrorState": "alerting",
               "for": "3m",
               "frequency": "1m",
               "handler": 1,
               "name": "HTTP HealthCheck alert",
               "noDataState": "keep_state",
               "notifications": [
                 {
                   "uid": "PagerDutyOnCall"
                 },
                 {
                   "uid": "SlackAlertProduction"
                 }
               ]
             },
             ~~
           },
panels.notifications でアラートの通知先を設定しています。Dashboards の値は Grafana のダッシュボードの設定の JSON Model から取得できます。ステージング環境でテスト用の Dashboard を作成して JSON を取得。notifications の uid を書き換えれば、簡単に作成できます。
Grafana のコード管理について、一通り説明しました。これでグラフやアラートの通知設定をコード管理できて、幸せな世界が生まれました。Grafana 自体にも履歴管理の仕組みがありますが、レビューしづらいのが難点です。Values を Git 管理することで、Pull Request でしっかりレビューできるようになります。
ここで、聡い方は「認証どうした??」と思うでしょう。そうです……認証設定は、やっていません。時間がなかったんです許してくだs
……気を取り直して Prometheus の方へいきましょう。認証なんてどうにでもなるんです。はい。
ldap.enabled や ldap.existingSecret, ldap.config を Values でサポートしているので良しなにできると思います(ぶん投げ
(3)Argo CD Helm Prometheus Manifest File
apiVersion: argoproj.io/v1alpha1
kind: Application
metadata:
 name: prometheus-staging
 namespace: argocd
spec:
 destination:
   namespace: prometheus
   server: https://kubernetes.default.svc
 project: monitoring
 source:
   path: kubernetes/prometheus/staging
   repoURL: https://github.com/xxx/xxx.git
   targetRevision: HEAD
 syncPolicy:
   automated:
     prune: true
---
apiVersion: argoproj.io/v1alpha1
kind: Application
metadata:
 name: prometheus-helm-staging
 namespace: argocd
spec:
 destination:
   namespace: prometheus
   server: https://kubernetes.default.svc
 project: monitoring
 source:
   repoURL: https://github.com/helm/charts.git
   targetRevision: 67ed74b614bb5f4e068017101a8673c63459f383
   path: stable/prometheus
   helm:
     parametrs:
     - name: alertmanager.persistentVolume.storageClass
       value: gp2
     releaseName: prometheus
     valueFiles:
     - https://raw.githubusercontent.com/helm/charts/67ed74b614bb5f4e068017101a8673c63459f383/stable/prometheus/values.yaml
     - https://xxx.s3-ap-northeast-1.amazonaws.com/helm/prometheus/staging/values.yaml?update=1
 syncPolicy:
   automated:
     prune: true
---
apiVersion: argoproj.io/v1alpha1
kind: Application
metadata:
 name: prometheus-blackbox-exporter-staging
 namespace: argocd
spec:
 destination:
   namespace: prometheus
   server: https://kubernetes.default.svc
 project: monitoring
 source:
   repoURL: https://github.com/helm/charts.git
   targetRevision: db4cea1fe9e634c51d91c47f1649cc17d42dc071
   path: stable/prometheus-blackbox-exporter
   helm:
     releaseName: prometheus-blackbox-exporter
 syncPolicy:
   automated:
     prune: true
Argo CD の Prometheus Helm の設定も Grafana とほぼ同じです。Plugin が追加されているくらいですね。Grafana でも Plugin を利用したい場合は、同様の書き方で追加できます。
Values ファイルは Grafana と比べるとシンプルになります。グラフがないだけで、かなりスッキリ。
server:
 persistentVolume:
   existingClaim: prometheus-server
extraScrapeConfigs: |
 - job_name: 'healthcheck'
   metrics_path: /probe
   params:
     module: [http_2xx]
   static_configs:
     - targets:
       - https://api.example.com
       - https://auth.example.com
       - https://example.com
   relabel_configs:
     - source_labels: [__address__]
       target_label: __param_target
     - source_labels: [__param_target]
       target_label: instance
     - target_label: __address__
       replacement: prometheus-blackbox-exporter:9115
 - job_name: 'slow-healthcheck'
   metrics_path: /probe
   params:
     module: [http_2xx]
   static_configs:
     - targets:
       - https://slow.example.com/
   scrape_timeout: 20s
   relabel_configs:
     - source_labels: [__address__]
       target_label: __param_target
     - source_labels: [__param_target]
       target_label: instance
     - target_label: __address__
       replacement: prometheus-blackbox-exporter:9115
Prometheus は Grafana に比べ、特記することがありません。Helm で管理されていない Plugin を追加したい場合は Argo CD の Kustomize などで追加してあげましょう。
おわりに
Argo CD で各種ツールの設定をコード管理することで、再現性のあるインフラが簡単に構築できるようになりました。本番アプリケーションだけでなく、周辺ツールのインフラもコード管理することで、引き継ぎや修復、修正が容易になります。
グラフやアラートは GUI でポチポチ設定するのが楽なため、ついついそれで済ませてしまいがちです。でもそれは、あくまでも一時的なものと捉えましょう。コードで管理して初めて「運用に乗った」と言えるんじゃないかと思います。
ただし、行き過ぎた管理は自分たち含めて苦しいだけなので、現状に合った方法を選択してください。
そして恒例の……We are hiring!!
Zaim ではインフラ改善やサーバーサイドのGo言語リプレイスに興味のあるエンジニアを募集しています!話だけでも聞きに来てくださいー!
この記事が気に入ったらサポートをしてみませんか?